
Carbon Footprint

Pomppa’ carbon footprint was calculated for the fifth time in 2025. The calculation was carried out using the OpenCO2net carbon footprint calculator, developed for the textile industry and based on the internationally recognized Greenhouse Gas (GHG) Protocol. It covers emissions from both our own operations as well as our products, manufacturing, and supply chain.
In 2025, we worked together with Finnish Textile & Fashion to further develop the carbon footprint calculator. The updated version now includes Scope 3 emissions from our supply chain more comprehensively, giving us a much clearer picture of the emissions created throughout our value chain.
Pomppa’ carbon footprint was calculated for the fifth time in 2025. The calculation was carried out using the OpenCO2net carbon footprint calculator, developed for the textile industry and based on the internationally recognized Greenhouse Gas (GHG) Protocol. It covers emissions from both our own operations as well as our products, manufacturing, and supply chain.
In 2025, we worked together with Finnish Textile & Fashion to further develop the carbon footprint calculator. The updated version now includes Scope 3 emissions from our supply chain more comprehensively, giving us a much clearer picture of the emissions created throughout our value chain.

Because of this update, our 2025 results cannot be directly compared with results from years before 2024. However, this does not mean our emissions suddenly increased. Instead, it means our carbon footprint calculation is now more complete and transparent. Better data helps us identify the biggest sources of emissions and focus our efforts where they can make the greatest difference.
We are committed to the Finnish Textile & Fashion Climate Commitment 2035. More importantly, we remain committed to continuously improving our sustainability work and reducing our environmental impact year after year.
Because of this update, our 2025 results cannot be directly compared with results from years before 2024. However, this does not mean our emissions suddenly increased. Instead, it means our carbon footprint calculation is now more complete and transparent. Better data helps us identify the biggest sources of emissions and focus our efforts where they can make the greatest difference.
We are committed to the Finnish Textile & Fashion Climate Commitment 2035. More importantly, we remain committed to continuously improving our sustainability work and reducing our environmental impact year after year.

Our Carbon Footprint in 2025
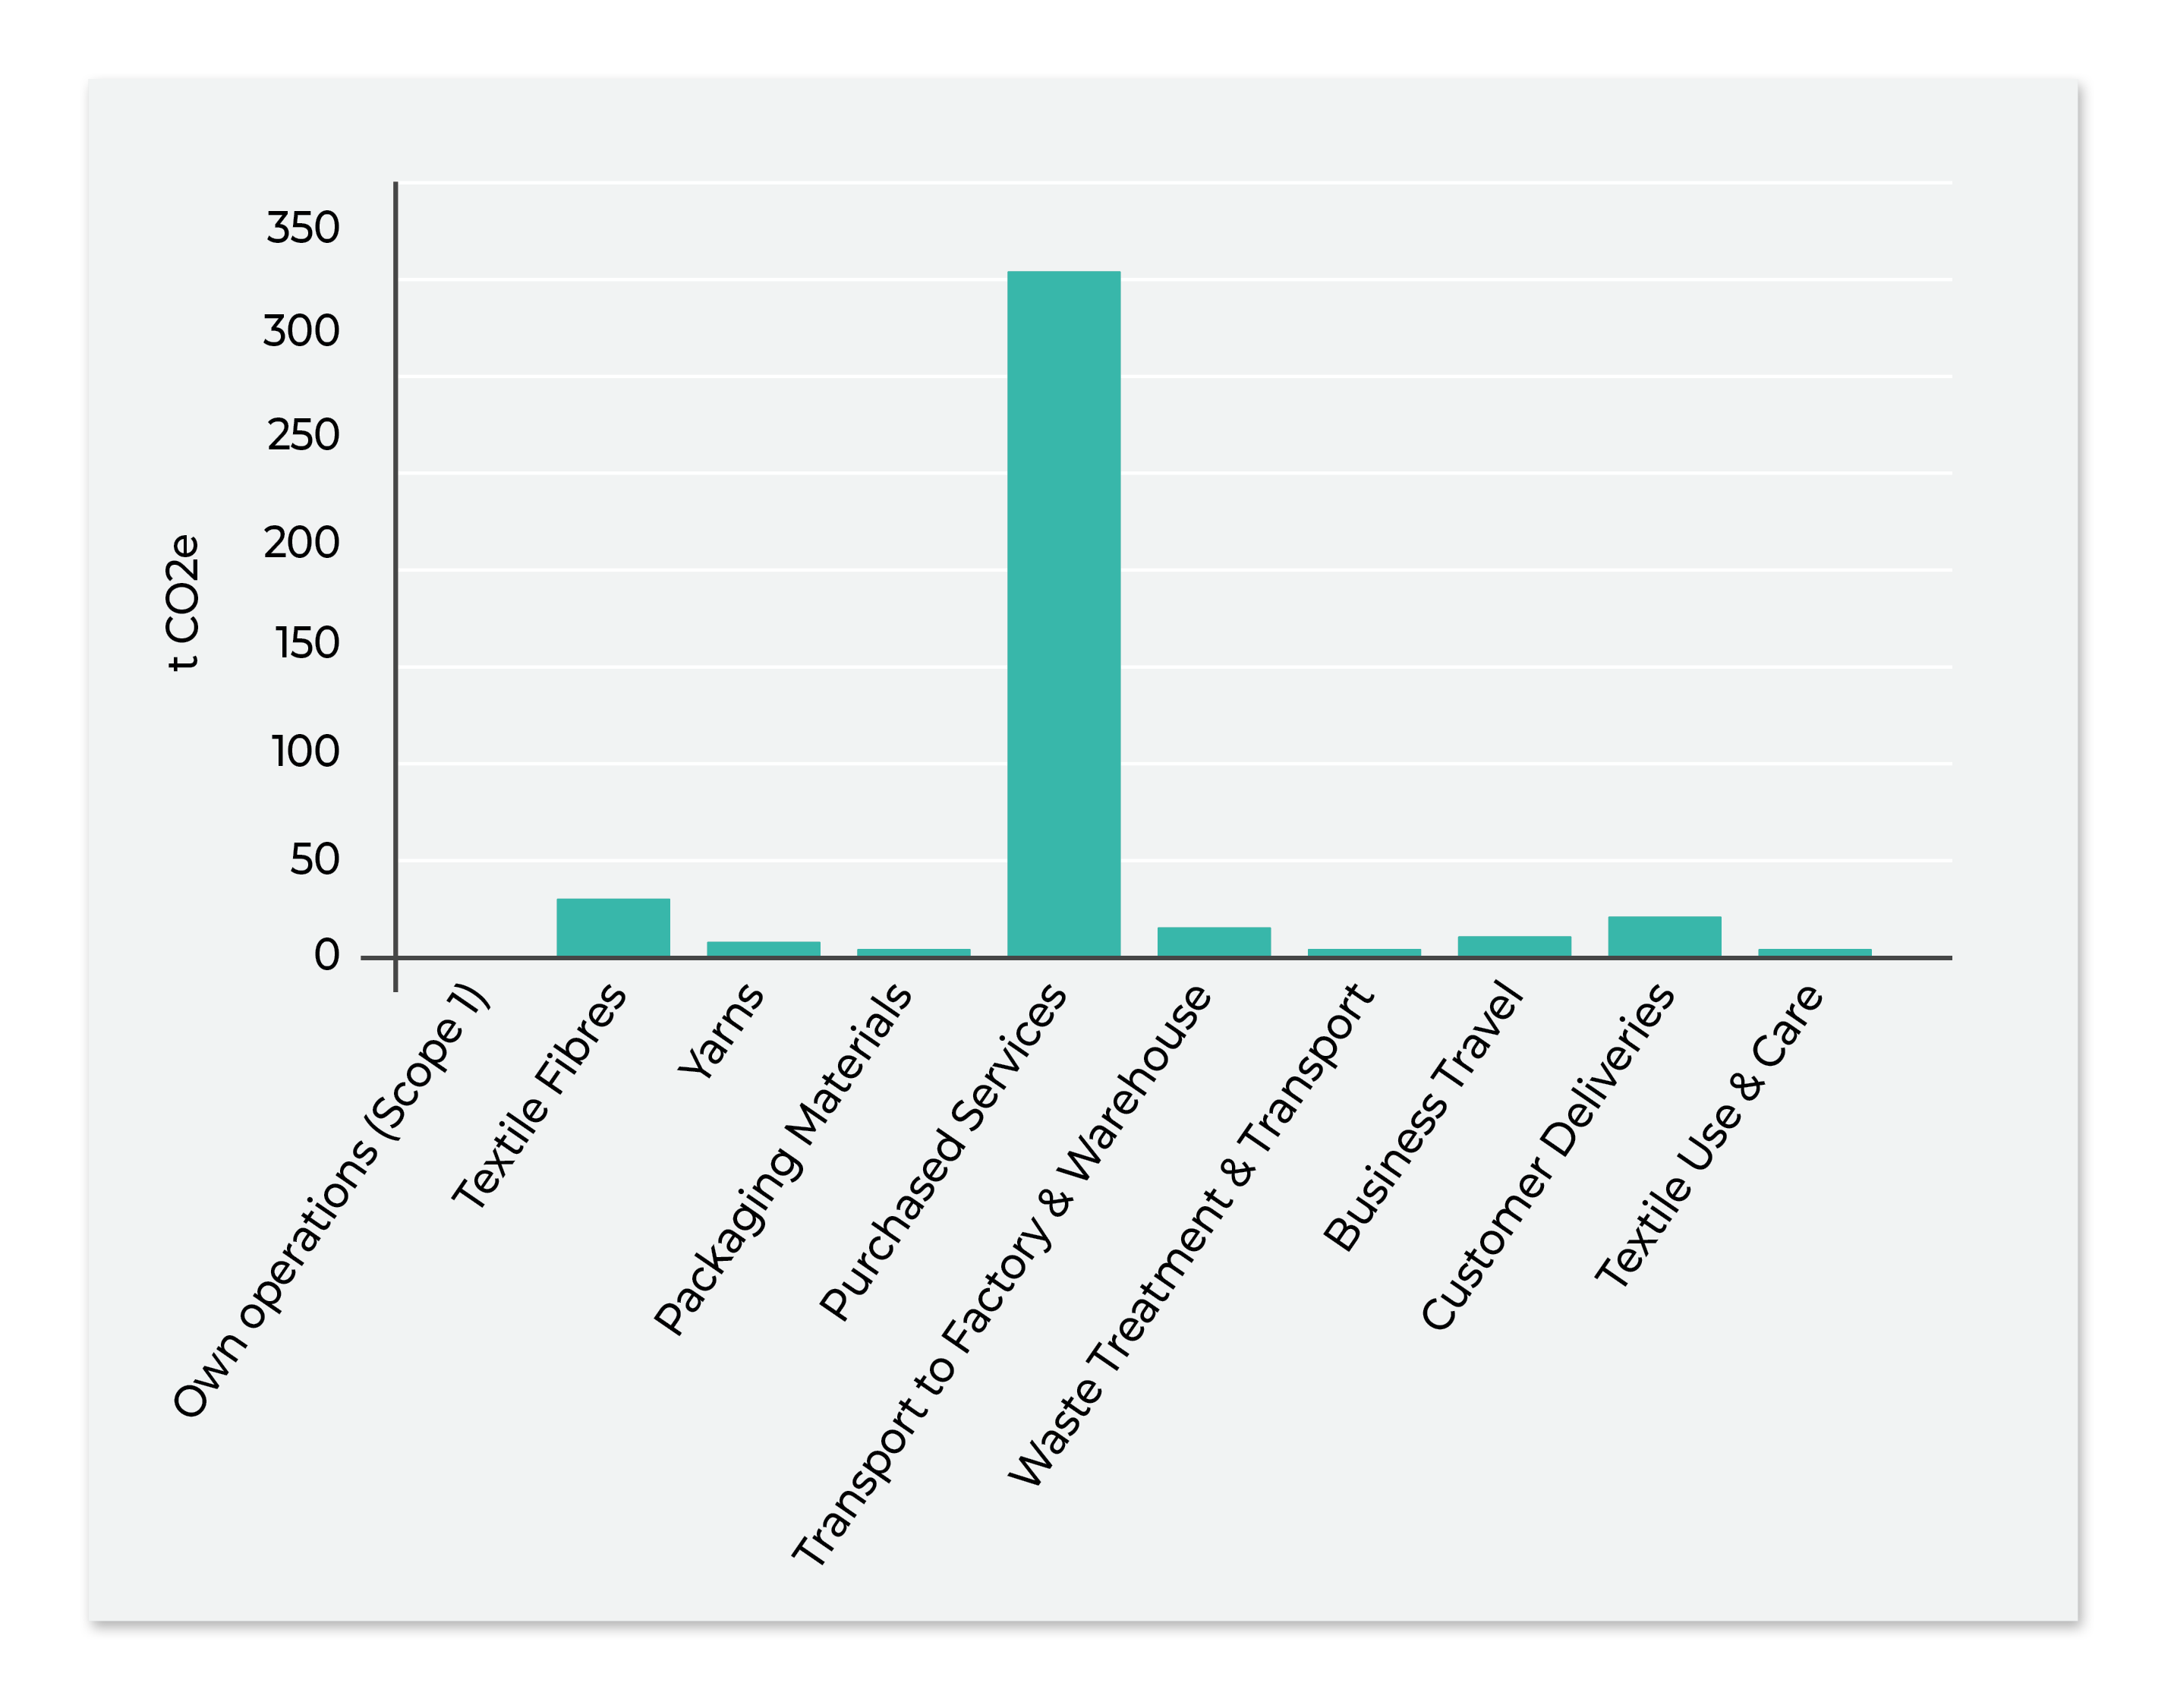
Pomppa's carbon footprint in 2025 was 404 tCO₂e. Compared to the previous year, our emissions decreased by 38%, mainly thanks to better planning of our material purchases. The largest share of our carbon footprint comes from product manufacturing, which accounted for 81% of our total emissions.
Pomppa's carbon footprint in 2025 was 404 tCO₂e. Compared to the previous year, our emissions decreased by 38%, mainly thanks to better planning of our material purchases. The largest share of our carbon footprint comes from product manufacturing, which accounted for 81% of our total emissions.

Carbon Footprint Summary 2025

In 2025, we reduced our carbon footprint across most of our major emission sources compared to the previous year. The biggest reductions came from our supply chain (Scope 3 Upstream), especially from textile materials.
Our biggest achievement was an 84% reduction in emissions from textile fibers compared to the previous year. This was mainly achieved by switching almost entirely to recycled polyester in our new products. We also reduced the use of higher-impact materials, such as teddy fabric and elastane, and used them only where they were truly needed. At the same time, we reduced the total amount of materials used.
In 2025, we reduced emissions in the following areas:
- Scope 1 emissions decreased by 100% thanks to the use of renewable energy.
- Emissions from textile materials decreased by approximately 84% through improved material choices.
- Estimated emissions from textile manufacturing decreased by approximately 23% thanks to better planning and producing quantities that better matched demand. An important part of sustainability is producing only what is needed and avoiding overproduction.
- Emissions from transport between our factories and warehouse decreased by approximately 32%. We only used air freight once during the year, and every sea container was shipped at full capacity, making our logistics more efficient.
- We reduced emissions from our packaging materials by approximately 11% by increasing the use of recycled materials.
- Estimated emissions from the use and care of our products decreased by approximately 22%, mainly due to lower sales volumes. The carbon footprint calculation assumes each product is washed five times per year.
In 2025, we reduced our carbon footprint across most of our major emission sources compared to the previous year. The biggest reductions came from our supply chain (Scope 3 Upstream), especially from textile materials.
Our biggest achievement was an 84% reduction in emissions from textile fibers compared to the previous year. This was mainly achieved by switching almost entirely to recycled polyester in our new products. We also reduced the use of higher-impact materials, such as teddy fabric and elastane, and used them only where they were truly needed. At the same time, we reduced the total amount of materials used.
In 2025, we reduced emissions in the following areas:
- Scope 1 emissions decreased by 100% thanks to the use of renewable energy.
- Emissions from textile materials decreased by approximately 84% through improved material choices.
- Estimated emissions from textile manufacturing decreased by approximately 23% thanks to better planning and producing quantities that better matched demand. An important part of sustainability is producing only what is needed and avoiding overproduction.
- Emissions from transport between our factories and warehouse decreased by approximately 32%. We only used air freight once during the year, and every sea container was shipped at full capacity, making our logistics more efficient.
- We reduced emissions from our packaging materials by approximately 11% by increasing the use of recycled materials.
- Estimated emissions from the use and care of our products decreased by approximately 22%, mainly due to lower sales volumes. The carbon footprint calculation assumes each product is washed five times per year.
Areas Where Emissions Increased in 2025:
Business Travel
Emissions from business travel increased by approximately 190% compared to the previous year. This was mainly due to factory visits, customer meetings, and trade fairs. Visiting our manufacturing partners allows us to assess their sustainability practices, discuss social responsibility face-to-face, and work together to improve our materials and manufacturing processes.
Although business travel emissions increased, they still represent only a small share of our total carbon footprint. We believe that close collaboration with our manufacturing partners is one of the most effective ways to reduce the lifetime emissions of our products, as the biggest environmental impacts come from material choices and manufacturing.
Customer Deliveries
Estimated emissions from customer deliveries increased compared to the previous year. This was partly due to improvements in emissions reporting and calculation methods used by transport providers, allowing delivery emissions to be measured more accurately than before. While the number of customer deliveries increased, especially direct-to-consumer orders,, the change cannot be explained by shipping volumes alone.
Global supply chains inevitably create emissions, but we continuously work to reduce their impact. Today, around 95% of our B2B deliveries are shipped using carbon-neutral transport services.
Looking Ahead
Our 2025 results show that the greatest opportunities for reducing our carbon footprint still lie in better material choices, improving our supply chain, and optimising transportation. Increasing the use of recycled materials, lowering the impact of our materials, and improving logistics have all led to significant emission reductions.
At the same time, improvements to our carbon footprint calculation give us a more accurate picture of our environmental impact. Better data helps us focus our efforts where they can make the biggest difference and supports our long-term commitment to reducing emissions across our entire value chain.